
In the competitive retail landscape, data analysis plays a pivotal role in improving sales strategies and customer engagement. In this case study, I performed a detailed analysis of retail product sales data to extract meaningful insights using Python. This article walks through the process, the techniques employed, and the key findings.
Project Overview
The primary objective of this analysis was to assess sales performance across product categories, identify customer segments, and uncover underlying trends in retail data. By doing so, we can provide actionable insights for optimizing product offerings, inventory management, and marketing efforts.
1. Data Preparation and Cleaning
The first step involved preparing the dataset for analysis. This included:
- Handling Missing Values: Any missing data points were addressed using appropriate techniques (e.g., filling or dropping based on the significance of missing information).
- Removing Duplicates: Ensured the dataset was free of redundant entries that could skew analysis results.
- Outlier Detection: Outliers were carefully reviewed and either removed or handled, especially for sales figures, which might result from one-time events (e.g., flash sales or extreme discounts).
By performing these steps, the dataset became clean, consistent, and ready for in-depth analysis.
2. Exploratory Data Analysis (EDA)
Exploratory data analysis was a critical phase, allowing us to understand the distribution and relationships between key variables.
Sales Performance Over Time
The data was segmented by date to analyze how sales varied across time periods (e.g., by month or quarter). This highlighted key trends like peak sales seasons and underperforming months.
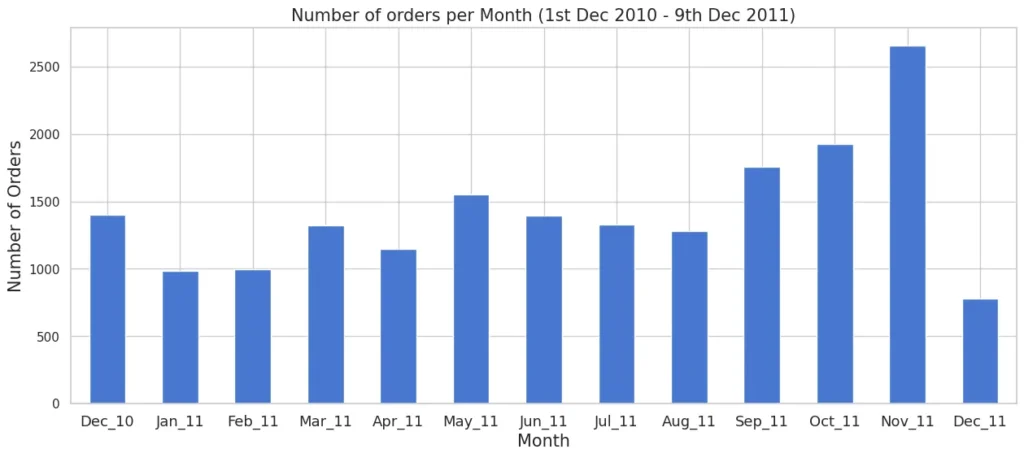
Key Finding: Sales tended to spike during certain holiday seasons (e.g., Black Friday, Christmas) and dip in mid-year periods, suggesting the need for promotions during these slower months.
Country-wise Sales Performance
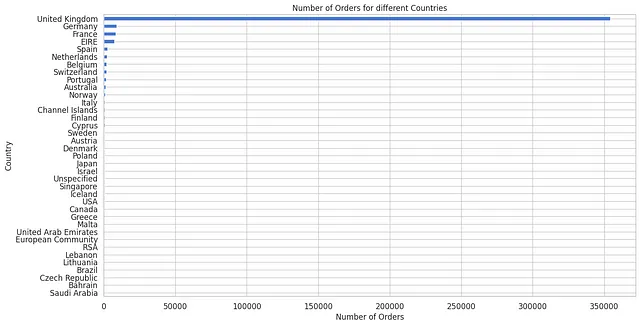
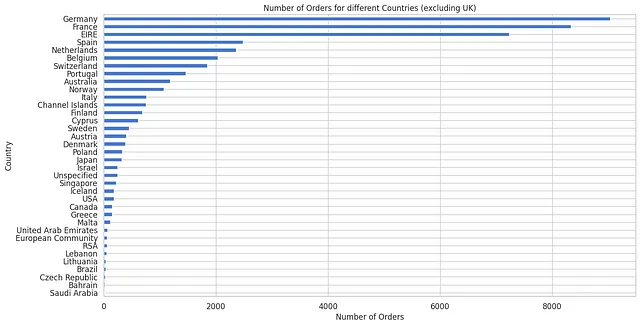
In this analysis, countries were compared to understand how different regions contributed to sales performance. This allowed us to see which countries are driving the highest number of orders and revenue.
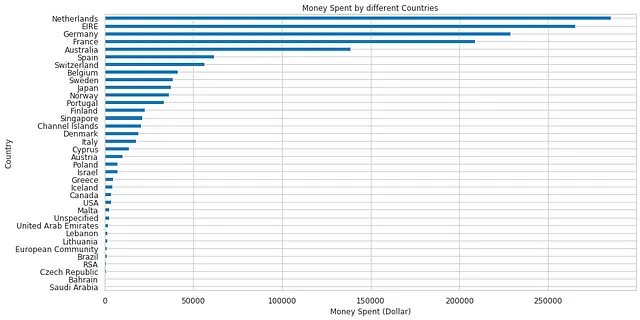
Key Finding: The United Kingdom and Germany dominated in terms of order volume, while the Netherlands, despite having fewer orders, generated the highest revenue. This indicates that customers in the Netherlands tend to place larger, higher-value orders, presenting an opportunity for targeted premium marketing campaigns.
Customer Purchase Behavior
By analyzing customer purchase frequency and basket size, patterns emerged showing how often customers make purchases and their average spending per order.
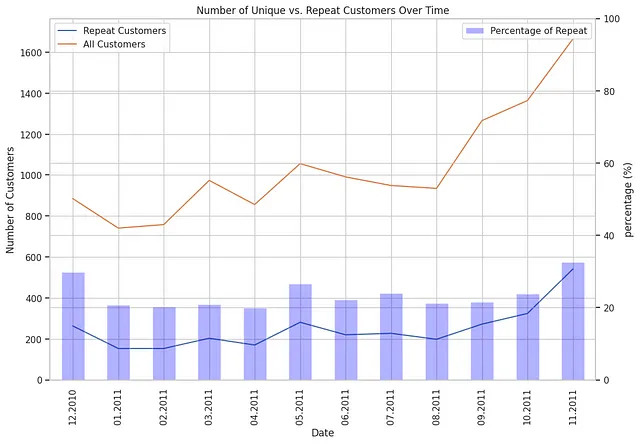
Key Finding: High-value customers who made frequent purchases contributed to a significant portion of the total revenue. However, there was a long tail of infrequent buyers with lower overall contribution.
3. Customer Segmentation
Using data on customer purchasing behavior, I applied clustering techniques to segment customers into distinct groups. This segmentation helped identify:
- High-Value Customers: Customers who frequently purchase and contribute significantly to sales.
- Occasional Buyers: Those who purchase sporadically and in smaller amounts.
- At-Risk Customers: Customers whose purchasing activity has decreased, potentially indicating churn.
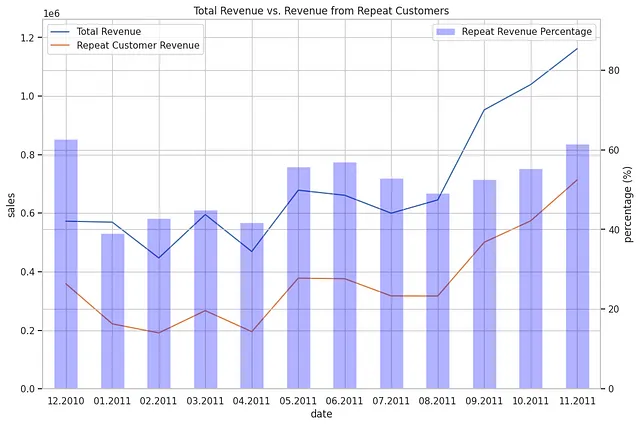
Key Finding: High-value customers represented around 20% of the customer base but contributed 60% of revenue, making them a key target for loyalty programs and personalized marketing.
4. Trend Discovery and Predictive Insights
Sales trends were analyzed by identifying seasonality and cyclical patterns. Time series analysis was used to predict future sales based on historical data.
Seasonality
Strong seasonal trends were evident, with notable peaks during major sales events (e.g., Black Friday) and holiday periods.
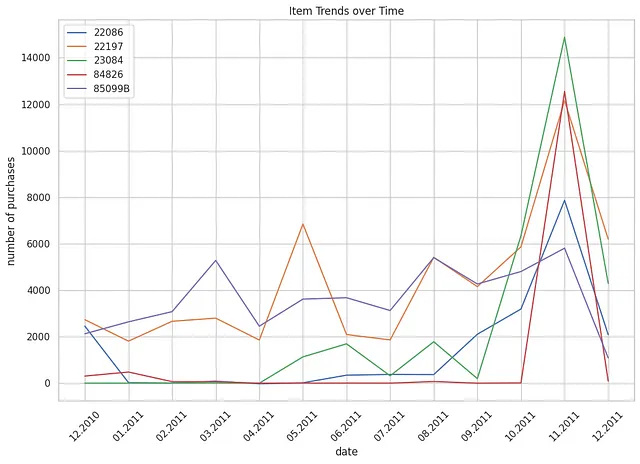
Inventory Insights
Product demand forecasts revealed which items needed restocking more frequently, helping to optimize inventory turnover and avoid stockouts.
Key Finding: Certain categories required more frequent restocking due to higher turnover, while slower-moving categories could benefit from targeted promotions to increase sales velocity.
5. Key Results and Insights
The analysis revealed several actionable insights:
- Importance of High-Value Customers: A small segment of high-value customers contributed to the bulk of revenue. These customers should be targeted with loyalty programs and personalized offers to ensure retention.
- Need for Seasonal Promotions: Sales spiked during holidays and specific events, confirming the importance of seasonality in planning marketing campaigns. However, there is an opportunity to boost sales during off-peak months through targeted promotions.
- Inventory Management Opportunities: By identifying slow-moving and fast-moving products, businesses can better manage inventory, preventing stockouts and reducing holding costs.
Conclusion
This case study demonstrates how retail businesses can leverage data analytics to gain valuable insights into sales performance, customer behavior, and trends. By using Python and libraries like Pandas and Plotly, I was able to uncover patterns that can drive business growth, improve inventory management, and tailor marketing strategies to boost revenue.
Code & Documentation
🔗 Find the complete code and documentation on my GitHub: