Introduction
In today’s competitive retail landscape, data plays a crucial role in business decision-making. To optimize sales performance and gain actionable insights, businesses need a well-structured Data Warehouse (DWH). This project presents a Sales Data Warehouse Design for a coffee shop business, enabling in-depth analysis of sales trends, store performance, product demand, and salesperson effectiveness.
Using a Star Schema approach, the data warehouse is designed for efficient querying and analysis. It integrates multiple data marts to facilitate business intelligence (BI) and support strategic decision-making.
1. Project Objectives
The primary goals of this data warehouse project include:
- Designing a scalable and efficient DWH schema for sales analytics.
- Developing an Entity-Relationship Diagram (ERD) to visualize data relationships.
- Implementing a Star Schema, ensuring high-performance analytical queries.
- Creating Data Marts to support business reporting and intelligence.
- Generating insights from sales data to optimize operations and marketing strategies.
This data warehouse solution provides structured, reliable, and actionable data for decision-makers.
2. Star Schema Design
The Star Schema is chosen due to its ability to handle large-scale analytical queries with ease. It consists of one central fact table that records transactions and multiple dimension tables that provide descriptive details.
ERD Diagram & Schema Overview
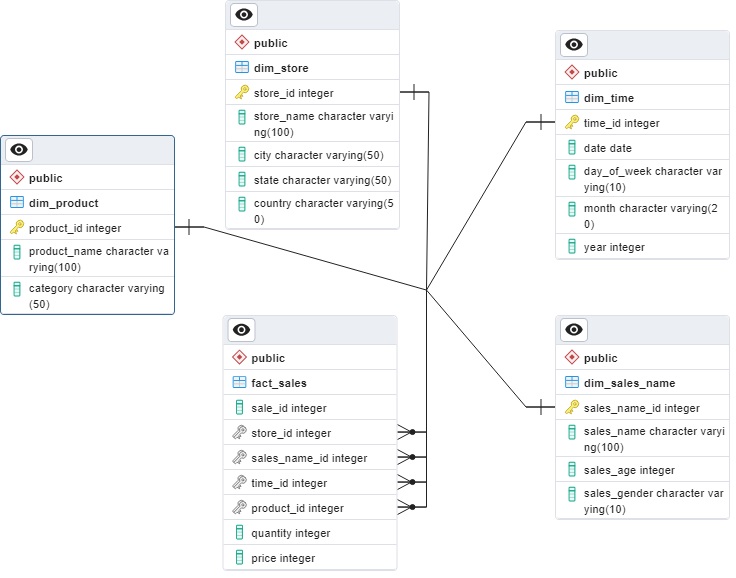
The Entity-Relationship Diagram (ERD) represents a Star Schema structure where:
- The Fact Table (
fact_sales) stores transactional data, linking to dimension tables through foreign keys. - Dimension Tables include:
- Product Information: Product name, category.
- Store Details: Store name, location.
- Time Information: Date, day, month, year.
- Salesperson Details: Salesperson name, age, gender.
The Star Schema model is optimized for quick aggregations and trend analysis, making it ideal for business intelligence reporting.
3. Data Marts & Business Insights
To extract meaningful insights from sales data, four data marts were created. Each data mart serves a unique analytical purpose.
a. Store Performance Analysis
- Objective: Evaluate the performance of each store based on revenue and sales volume.
- Insights:
- “Starbucks Corner” in Chicago leads in total sales volume and revenue.
- “Downtown Starbucks” in Los Angeles has the highest revenue per transaction, suggesting effective pricing strategies.
- Replicating successful store strategies can boost revenue across locations.
- Recommendations:
- Assess why certain stores outperform others in terms of revenue per unit.
- Implement promotional offers in underperforming locations.
b. Best-Selling Products
- Objective: Identify top-performing products and categories.
- Insights:
- Coffee products dominate overall sales.
- The most popular items include Flat White, Caramel Macchiato, and Iced Green Tea Latte.
- Bakery products (e.g., Croissant) show strong demand, indicating cross-selling potential.
- Recommendations:
- Offer bundled promotions pairing bakery items with coffee.
- Adjust pricing strategies for premium drinks to increase per-unit revenue.
- Monitor seasonal product trends (e.g., Pumpkin Spice Latte).
c. Salesperson Performance
- Objective: Evaluate individual and team-level sales effectiveness.
- Insights:
- John Doe is the top-performing salesperson, excelling in both transaction volume and revenue generation.
- Jane Smith specializes in higher-priced transactions, indicating strong premium product sales.
- Certain salespersons rely on high-volume, low-value transactions, while others generate revenue through premium pricing.
- Recommendations:
- Identify best-selling techniques used by top performers and incorporate them into training programs.
- Encourage upselling strategies for salespeople with lower revenue per transaction.
- Implement a reward program to incentivize top performers.
d. Sales Trends Over Time
- Objective: Identify sales trends by day of the week.
- Insights:
- Monday and Tuesday are the highest revenue-generating days.
- Sunday has the lowest sales volume, possibly due to lower customer footfall.
- Midweek promotions (e.g., Wednesday deals) boost transaction volume but reduce the average price per unit.
- Recommendations:
- Leverage high-performing days (Monday & Tuesday) for product launches and premium promotions.
- Introduce weekend-exclusive discounts to increase sales on slower days.
- Optimize pricing strategies to maintain high revenue on midweek promotions.
4. Conclusion & Key Takeaways
The Sales Data Warehouse provides a robust, structured, and optimized system for sales analytics. By implementing a Star Schema, this solution enables businesses to quickly process large amounts of data and extract key insights.
Key Findings
✅ Store Performance: Starbucks Corner leads in sales volume, while Downtown Starbucks excels in per-unit revenue.
✅ Product Trends: Coffee remains the top-selling category, with bakery items showing strong demand.
✅ Salesperson Insights: Top salespeople drive revenue through effective pricing and upselling strategies.
✅ Time-Based Trends: Mondays and Tuesdays are the most profitable days, while weekends show growth potential.
Business Impact
This data warehouse model empowers business owners and managers by:
- Providing real-time insights into store, product, and sales trends.
- Enabling data-driven decision-making for pricing, promotions, and operations.
- Supporting scalability for future data expansion and advanced analytics.
With this structured data-driven approach, businesses can maximize sales performance, optimize resources, and drive sustainable growth.