
📌 Project Overview
This project analyzes Sales Performance, RFM Segmentation, Cohort Analysis, Churn Prediction, and Customer Lifetime Value (CLV) Optimization for Kalbe Nutritionals using SQL, Python, and Tableau. The data is processed using SQL, analyzed in Python, and visualized in Tableau to provide actionable business insights.
📊 Dashboard
You can explore the interactive business performance dashboard on Tableau: 👉 Tableau Dashboard
🔍 Key Insights & Analysis
The project includes:
- Sales Analysis to understand revenue trends and key performance indicators.
- RFM Segmentation (Recency, Frequency, Monetary) to classify customers based on purchasing behavior.
- Cohort Analysis to analyze customer retention and repeat purchases.
- Churn Analysis to identify at-risk customers and develop retention strategies.
- CLV (Customer Lifetime Value) Optimization to maximize long-term customer revenue.
📂 Repository Structure
📦 Kalbe-Nutritionals-BI-Final-Project-Sales-RFM-Cohort-Churn-CLV-Optimization
├── 📂 Cleaned Data                # Cleaned data for analysis
├── 📂 Dashboard                   # Business recommendation & visualizations
├── 📂 Dataset Kalbe               # Raw dataset files
├── 📄 01. Combine Kalbe Data.ipynb # Python script to merge data
├── 📄 02. Preprocessing.ipynb      # EDA & RFM analysis
├── 📄 03. Churn Analysis.ipynb     # Churn modeling & insights
├── 📄 04. Cohort Query.sql         # SQL script for cohort retention analysis
├── 📄 Presentation.pdf             # Final project presentation
├── 📄 README.md                    # Project documentation
📈 Dashboards Preview
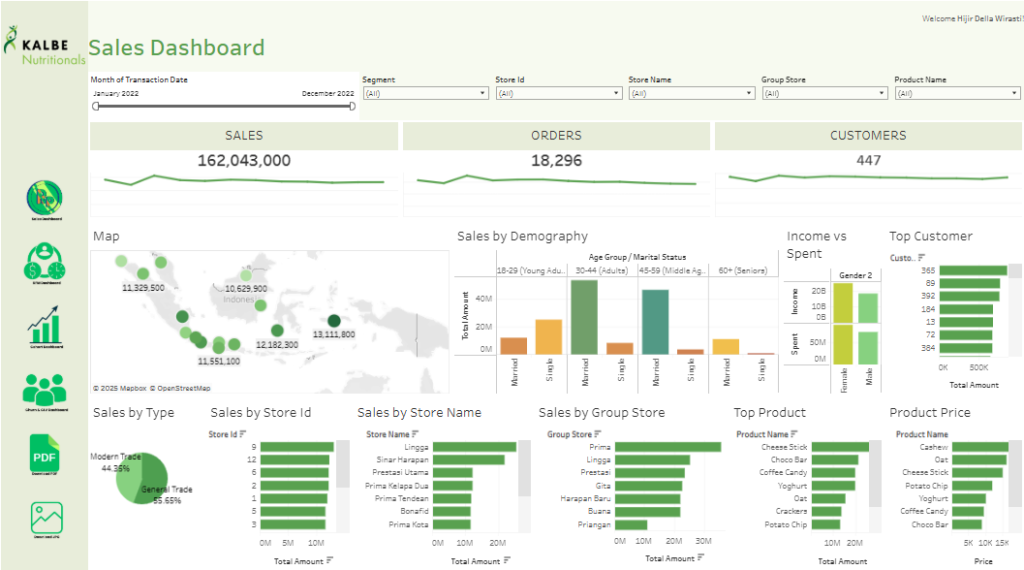
Sales Dashboard
Tableau
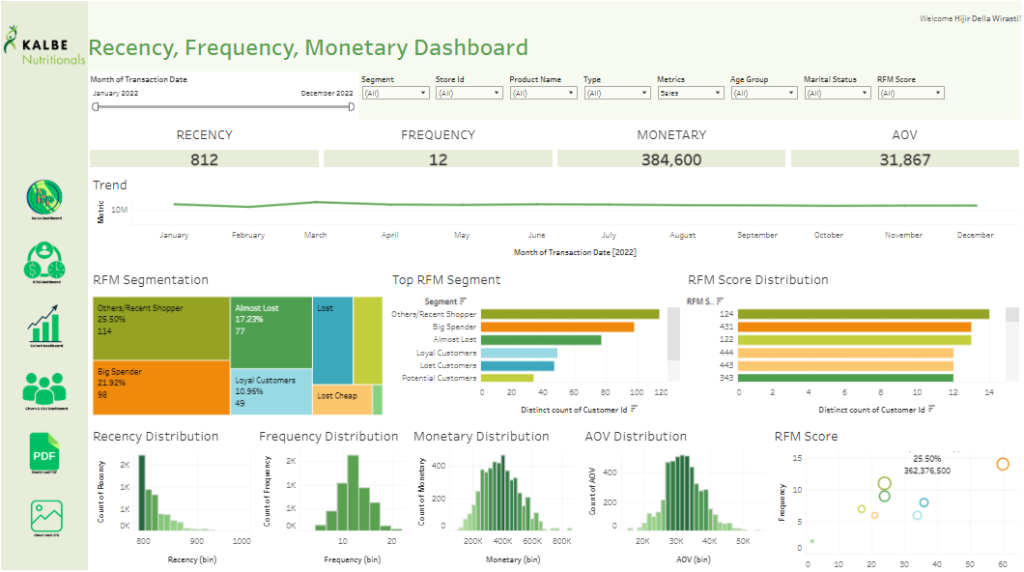
RFM Segmentation
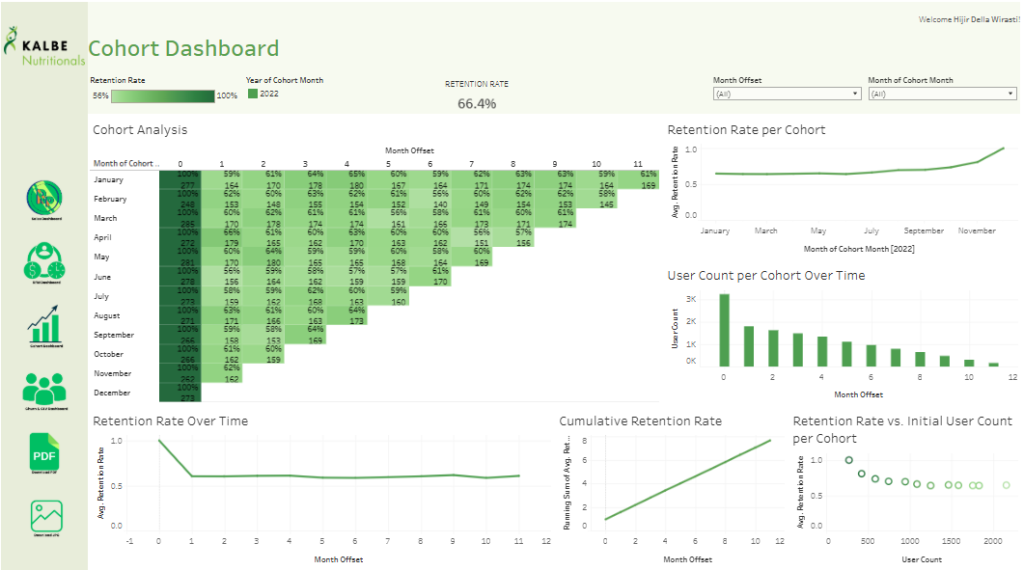
Cohort Analysis
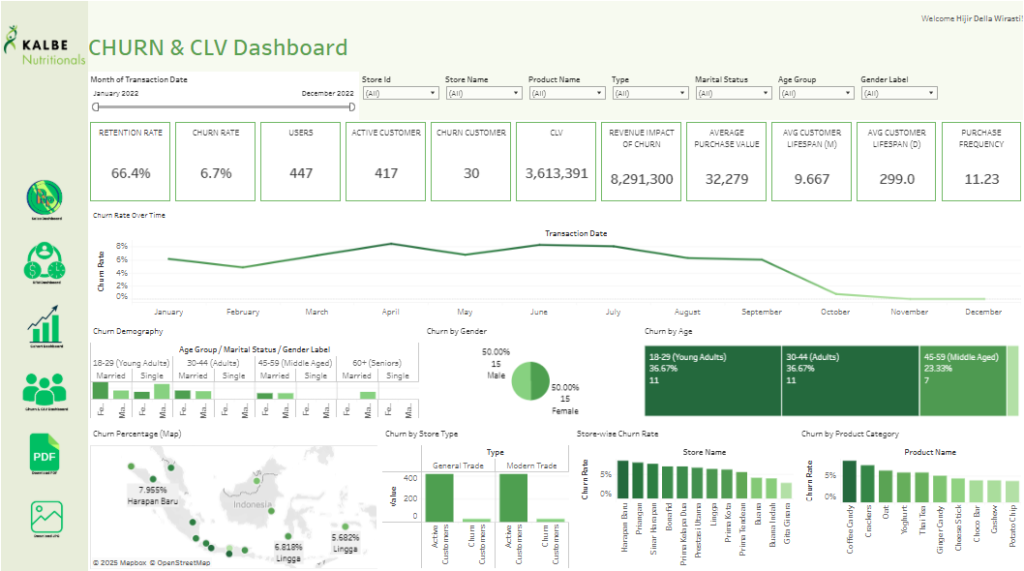
Churn Analysis
📌 Business Recommendation
Recomm. | Insights | Actionable Items |
Expand High-Sales Regions | Eastern Indonesia & Sulawesi lead sales, while Jakarta & Java have potential for growth | 1. Strengthen distributor partnerships in top regions. 2. Invest in marketing to boost Jakarta & Java performance. 3. Explore expansion in Sumatra & Kalimantan. |
Boost Retention & Reduce Churn | Retention is 66.4%, but churn (6.7%) is rising, especially among 18-44-year-olds and in Harapan Baru & Lingga. | 1. Implement personalized retention campaigns. 2. Re-engage high-churn locations with exclusive offers. 3. Strengthen onboarding & loyalty programs. |
Enhance RFM-Based Customer Engagement | Big Spenders (21.92%) & Loyal Customers (10.96%) drive sales, while Almost Lost (17.23%) are at risk. | 1. Offer VIP perks for top customers. 2. Run win-back campaigns for Almost Lost. 3. Convert Recent Shoppers (25.5%) into repeat buyers.. |
Optimize Product & Pricing Strategy | High AOV (31,867) but churn on certain products (e.g., Coffee Candy & Choco Bar). | 1. Upsell premium products like Cashew & Oat. 2. Reduce churn on low-retention products with bundles/discounts. 3. Implement repeat purchase incentives (e.g., buy 3x, get 1 free). |
Leverage Best-Selling & High-Priced Products | Yoghurt, Oat, & Crackers lead in sales, while Potato Chips, Coffee Candy, & Choco Bar are high-priced. | 1. Promote best-sellers with targeted ads & bundling. 2. Introduce premium packaging & branding for high-priced products. 3. Offer trial packs or discounts to drive demand for premium items. |
Increase Sales of Low-Performing Products | These products (Thai Tea, Cashew, Ginger Candy) have lower sales and need better positioning. | 1. Bundle Thai Tea with best-sellers (e.g., Coffee Candy). 2. Rebrand Cashew as a premium snack with gift-worthy packaging. 3. Position Ginger Candy for health-conscious consumers with immunity-boosting messaging. |
Encourage Repeat Purchases | Cheese Stick is the top-selling product, but can be optimized further. | 1. Exclusive Cheese Stick multipacks (e.g., family-size or snack packs) to drive bulk purchases. 2. Limited-edition seasonal flavors to create excitement & urgency. 3. Loyalty points for frequent buyers (e.g., buy 5, get 1 free). |
🚀 Tools & Technologies
- SQL: Data extraction & transformation
- Python: Data preprocessing, feature engineering, and modeling
- Tableau: Data visualization and dashboard creation
🎯 Conclusion
This project helps Kalbe Nutritionals understand sales dynamics, customer segmentation, and retention strategies to optimize customer lifetime value (CLV). By leveraging data-driven insights, businesses can improve sales performance and customer loyalty.
Code & Documentation
🔗 Find the complete code, query and documentation on my GitHub: